Overview
MuleSoft is an integration platform that connects various systems, applications, and data sources across an organisation. In terms of memory management, MuleSoft’s runtime engine, known as Mule Runtime, efficiently manages memory usage to ensure optimal performance and resource utilisation. Here’s an overview of key aspects related to memory management in MuleSoft:
- Java Virtual Machine (JVM): MuleSoft applications run on the Java Virtual Machine (JVM), which handles memory allocation and garbage collection. JVM manages memory in the form of heap memory and non-heap memory.
- Heap memory: This is where MuleSoft stores objects created during application execution. It consists of two main parts: Young Generation and Old Generation. The Young Generation space is where new objects are allocated, and the Old Generation space is for long-lived objects. MuleSoft applications can configure heap memory settings using JVM options such as -Xms (initial heap size) and -Xmx (maximum heap size) to optimise memory usage based on application requirements.
- Garbage Collection (GC): JVM’s garbage collector automatically reclaims memory by removing objects no longer referenced by the application. MuleSoft developers can tune GC settings to optimise performance and reduce pauses caused by garbage collection. Options such as the choice of garbage collector algorithm (e.g. G1GC, CMS) and tuning parameters (e.g. heap size, GC intervals) are available for customisation.
- Non-heap memory: This memory area includes Metaspace (replacing PermGen in older JVM versions), which stores class metadata and native memory used by JVM for internal processing and native libraries.
- Monitoring and tuning: MuleSoft provides monitoring and management capabilities through tools like Anypoint Runtime Manager and Anypoint Monitoring. These tools allow administrators to monitor memory usage, analyse performance metrics, and troubleshoot issues. Additionally, developers can use profiling tools like VisualVM or YourKit to analyse memory usage and identify memory leaks or inefficiencies in MuleSoft applications.
- Best practices: Following best practices in MuleSoft development can help optimise memory usage. This includes:
- Designing efficient integration flows
- Minimising object creation
- Using streaming when handling large payloads
- Implementing error handling and retry mechanisms to prevent memory leaks and excessive resource consumption.
Thread dump
- Immediately download a thread dump for troubleshooting.
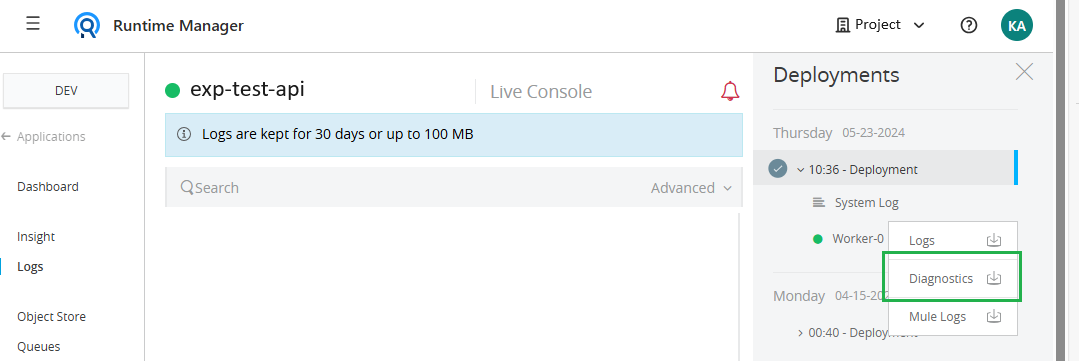
- Go to ‘Runtime Manager’.
- Select the Mule application and Logs.
- On the right side, select the latest deployment and download Diagnostics (thread dump).
- Using a thread dump analyser (ie FastThread), upload the thread dump and generate an analysis report. This will help detect and resolve blocked threads, deadlocks and CPU spikes.
Simulate CloudHub 0.x vCore Workers in Anypoint Studio
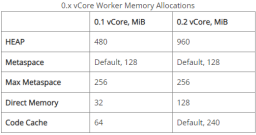
In the meantime, the Mule application settings in CloudHub can also be simulated locally. The table below contains typical parameters of memory close to 0.x vCore workers:
- In Anypoint Studio, open the application run configuration and input these VM arguments.
For 0.1 vCore:
- Xms480m
- Xmx480m
- XX:ReservedCodeCacheSize=64m
- XX:MaxDirectMemorySize=32m
- XX:MaxMetaspaceSize=256m
For 0.2 vCore
- Xms960m
- Xmx960m
- XX:MaxDirectMemorySize=128m
- XX:MaxMetaspaceSize=256m
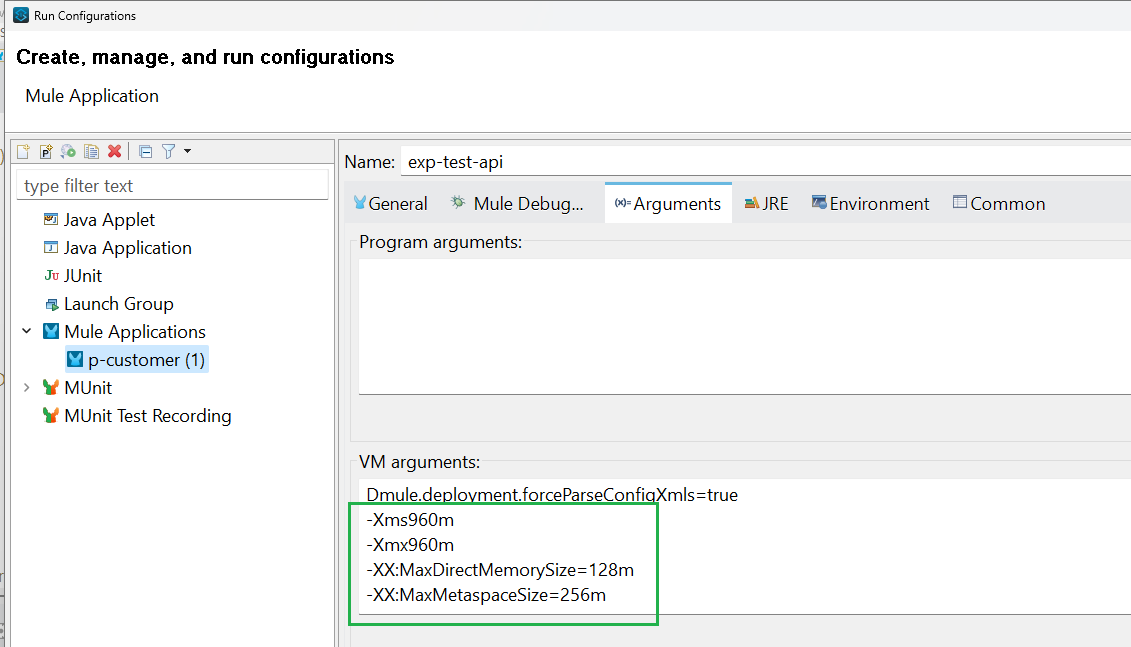
- Save and run the application.
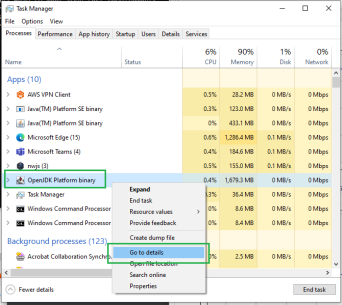
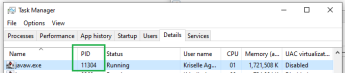
- To start monitoring using JConsole (Windows), go to the Task Manager and get the application’s process ID (PID).
- Right-click on ‘OpenJDK Platform binary’
- Click ‘Go to details’.
- For other operating systems, please refer to the instructions in this article.
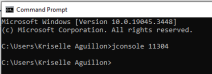
- Start JConsole by entering ‘jconsole <PID>’ in the command terminal. The console will automatically pop up. Click ‘insecure connection’ to proceed.
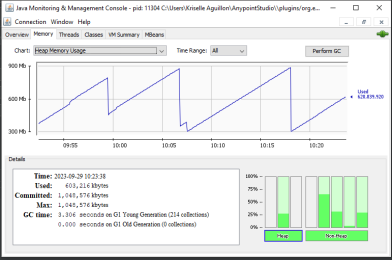
- Since the application is running, the graphs should automatically be populated. You may send bulk requests to the application (using JMeter) and see how memory, thread and CPU behave. You may notice that even though the application is idle, the heap memory keeps on increasing. However, the garbage collection is doing its job by clearing the memory, as you will see drops in heap usage.
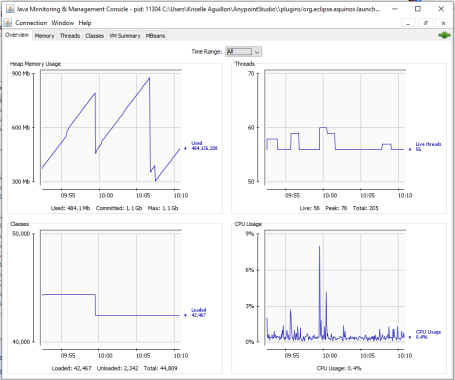
A spike in heap is also visible when a bulk of requests is sent to the application.
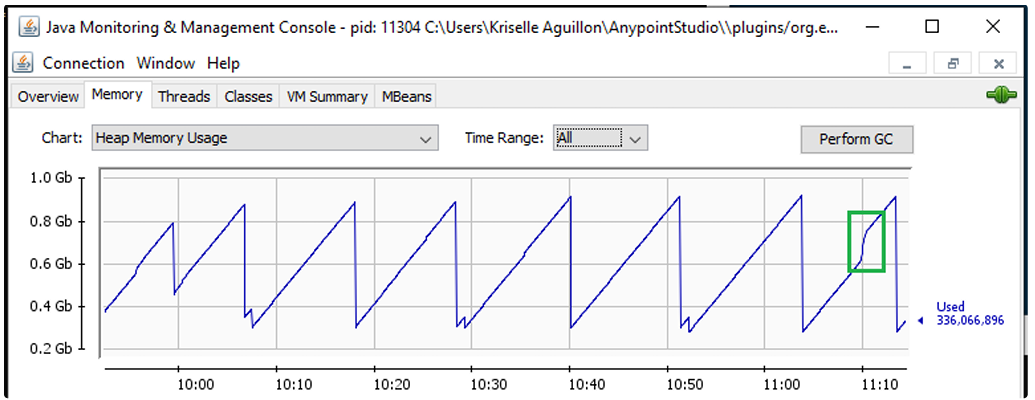
CloudHub uses a parallel garbage collector. Franz Knupfer from New Relic describes it this way: “The parallel garbage collector is JVM’s default garbage collector. As the name implies this garbage collector uses multiple (parallel) threads. Because it can also use multiple CPUs to speed up throughput, it’s also known as the throughput collector. However, when running garbage collection, it will also freeze application threads.”
Metrics
- Go to ‘Anypoint Monitoring’
- Click ‘Built-in Dashboards’
- Select the Production environment and the CloudHub app.
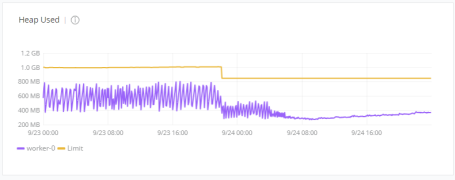
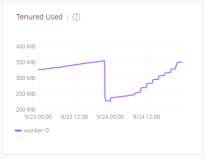
Check the Heap Used and Tenure Used and see if there’s a drop in usage; this indicates that a MAJOR garbage collection was successfully executed, and the application is expected to remain stable.
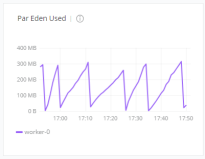
To check when MINOR garbage collections are executed, check usage drops in Par Eden Used.
Logs
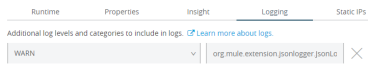
One of the common causes of high memory and slowness of the application is the high load of logs. To temporarily resolve this, go to Runtime Manager and temporarily set the logging level to WARN.
Heap dump
To further investigate, we may identify which processes mostly contribute to the heap memory. To do this, you may create a support ticket in MuleSoft Help Center to request a heap dump. The support team only provides a heap dump if there is an evident production issue.
Conclusion
Overall, effective memory management is crucial for ensuring the reliability, scalability, and performance of MuleSoft integration solutions, and understanding the principles and tools available for memory management is essential for MuleSoft developers and administrators.